
Consistent behavior in Quick Search
In the previous release, searching Address Book entries and selecting one from suggestions would add it to the current list. However, when searching companies, individuals, or contacts, selecting an entry would replace the entire list. This release changes the behavior for companies, individuals, and contacts. Now, selecting an entry from suggestions will add it to the current list, consistent with Address Book entries.
Mobile
Quick actions are available for opportunities and cases
Quick action buttons are added into opportunities and cases for quickly logging phone calls and chats and sending email.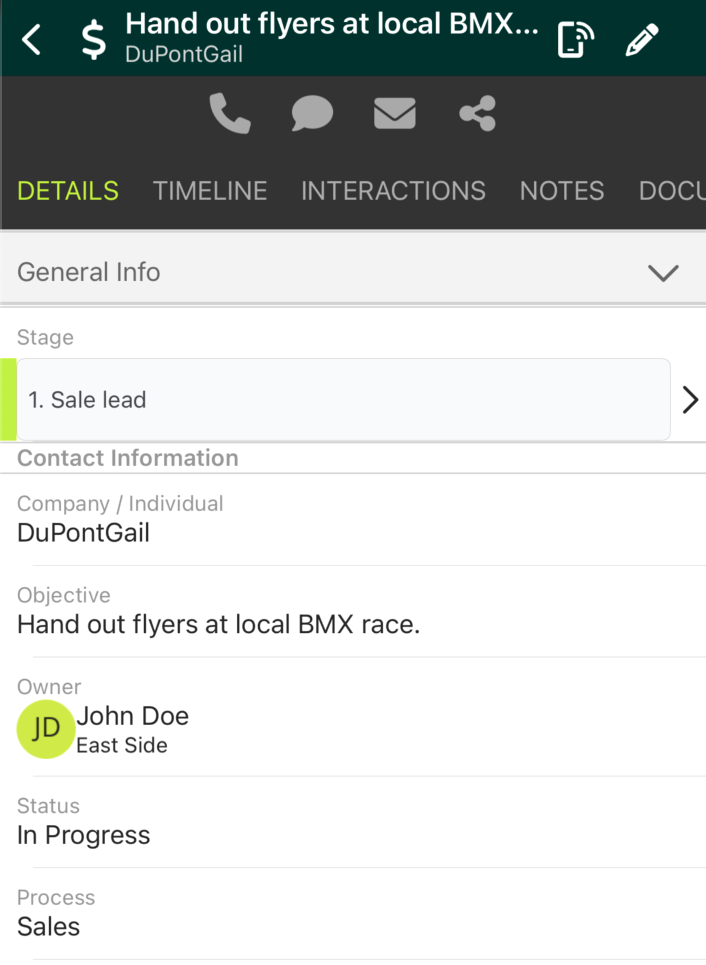 Share entries by URL
You can now share Address Book entries, opportunities, cases, or leads from your mobile device. Tapping the Share button copies the entry's URL to your clipboard. You can then paste this link into an email or chat to share it with other users.
When users click the link, a new browser tab opens. After logging in, they'll see the shared entry displayed.
Scan business card is available in Today's Business screen
You can now use our AI powered scan business card feature to create leads from the Today's Business screen.
Integrations
Maximizer App for Outlook – New Capabilities
Save Emails to Cases and Opportunities in Maximizer
Maximizer users can now save emails directly to Cases and Opportunities from Outlook. This streamlined capability ensures key email communications are precisely captured and organized, improving team visibility and record accuracy for more effective case and opportunity management.
Create Cases in Maximizer from within the Outlook
Quickly create new Cases in Maximizer from Outlook, saving time and clicks. This feature streamlines case creation, letting you manage issues directly from your inbox for faster, more efficient workflows.
Teams Meeting Integration
The Microsoft Teams Meeting integration for Maximizer enables users to effortlessly schedule and join virtual meetings directly from the CRM, streamlining their workflow. With a simple toggle, users can instantly add a Teams meeting link while creating an appointment in Maximizer, eliminating the hassle of manual link setup. Meeting details are automatically embedded in appointment invites, making scheduling faster and more efficient with just a quick confirmation before sending. Boost your productivity and simplify your scheduling process with this powerful integration!
Highlights:
- Effortlessly add Microsoft Teams meeting links when creating appointments in Maximizer.
- Automatically embed full meeting details, including the connection link, in appointment invitation emails.
- Save time and increase productivity by managing both scheduling and virtual meetings directly within your CRM.
User Guide: Microsoft Teams Meeting – Maximizer
Zapier Integration Now Allows to Clean Existing Entries in Specific Fields
The Zapier integration now supports clearing specific field entries using the keyword $$CLEAR$$ for a streamlined data management process. This feature is available in the following Zapier actions:
- Update Address Book Entry
- Update Lead
- Update Case
- Update Opportunity
- Update Appointment
- Update Favorite List
- Update Note
- Update Task
Note:: Date fields cannot be cleared.
Easily manage and clean up records by removing outdated or unnecessary information in just a few clicks.
Connect Maximizer with Fathom via Zapier
Maximizer’s Zapier integration with Fathom, an AI tool that transcribes and summarizes meetings, streamlines data capture for sales professionals. Automatically save key insights, meeting summaries, and action items from Fathom directly into Maximizer as notes or tasks—no manual entry required.
Popular Workflows:
- Save AI meeting summaries from Fathom to Maximizer as notes.
- Automatically create tasks in Maximizer from Fathom action items.
- Save key highlights from Fathom as notes in Maximizer.
Boost productivity and keep all important details organized in your CRM effortlessly.
Intelligence
Leading Indicators:
The new dashboard of leading indicators will provide better data snapshots of the Sales Rep. This dashboard is intended to be used a sales performance review for Sales Leaders, where they can easily detect if the Rep is likely achieving his/her targets and how can the leader help achieve their quota.
Requirements:
This is the UI of the whole dashboard
Filters:
The following filters will be available for the users:
- People Picker
- Owner
- Date
- Process
- Stage
- Revenue Type
Breaking it down into each card/widget:
|
KPI Name
|
Description
|
Formula
|
Required Fields
|
|
Name of the Leader
|
The name of the sales team leader.
|
N/A
|
Leader Name
|
|
Win Rate
|
The percentage of Opportunities that are won.
|
Divide the total number of Opportunities won by the total number of Opportunities in the pipeline, then multiply by 100 to get a percentage.
(Opps[won]/Opps[in progress])*100
|
Opportunities
|
|
Forecast Accuracy
|
Measure the accuracy of sales forecasts by comparing predicted sales outcomes with actual results.
|
((Won Corporate Revenue - Forecasted Opportunities) /Won Corporate Revenue )* 100
|
Corporate Opp, Forecast Opp
|
Description added in the "info" button:
-
Win Rate
- Description: Percentage of opportunities that are successfully closed as "won."
- Calculation: (Number of Won Opportunities / Total Opportunities) * 100
- Example: If 20 out of 50 opportunities are won, the Win Rate is (20/50) * 100 = 40%.
-
Forecast Accuracy
- Description: Measures the accuracy of predicted sales outcomes compared to actual results.
- Calculation: (Actual Sales Revenue / Forecasted Sales Revenue) * 100
- Example: If forecasted revenue was $500,000 and actual revenue was $450,000, Forecast Accuracy is ($450,000 / $500,000) * 100 = 90%.
Interaction Efficiency
This widget is based in the number of interactions vs the activity target. The color code rules are as follow:
- Activities >= Target (Green)
- Activities < Target (Orange)
The following table is an example of the interaction types vs the targets, each customer database will have different interactions types, so this widget will have to show the configuration made by the customer. For example, if they have a new interaction type named "Coffe chat" and an assigned icon, then it will have to be included in the list in this widget.
|
KPI Name
|
Description
|
Formula
|
Required Fields
|
|
Total Calls vs Target
|
Number of calls made compared to the target number of calls.
|
(Total Calls / Target Calls) * 100
|
Total Calls, Target Calls
|
|
Total Emails vs Target
|
Number of emails sent compared to the target number of emails.
|
(Total Emails / Target Emails) * 100
|
Total Emails, Target Emails
|
|
Total Messages vs Target
|
Number of messages sent compared to the target number of messages.
|
(Total Messages / Target Messages) * 100
|
Total Messages, Target Messages
|
|
Total Appointments vs Target
|
Number of appointments set compared to the target number of appointments.
|
(Total Appointments / Target Appointments) * 100
|
Total Appointments, Target Appointments
|
Description info to be added in the "info" button:
-
Interaction Efficiency for Closed Deals
- Description: Total number of interactions (calls, emails, etc.) for deals that were successfully closed.
- Calculation: Sum of interactions (calls, emails, meetings, etc.) for each closed deal (Won or Lost).
- Example: If a rep closed 5 deals with 20 calls and 10 emails per deal, Interaction Efficiency is the total of those interactions.
Opportunities related insights
Color code rules:
- In progess (Number of opportunities) = green
- In progress value = green
- Won = green
- Lost = red
|
KPI Name
|
Description
|
Formula
|
Required Fields
|
|
Number of Opps in Progress
|
Total number of opportunities currently in progress.
|
Count of opportunities in progress
|
Opportunity Status
|
|
Value of Opps in Progress
|
Total value of opportunities currently in progress.
|
Sum of opportunity values in progress
|
Opportunity Value, Opportunity Status
|
|
Value of Won Opportunities
|
Total value of opportunities that have been won.
|
Sum of values of won opportunities
|
Opportunity Value, Opportunity Status
|
|
Value of Lost Opportunities
|
Total value of opportunities that have been lost.
|
Sum of values of lost opportunities
|
Opportunity Value, Opportunity Status
|
Description info to be added in the "info" button:
-
Opportunities in Progress
- Description: Number of open opportunities that are currently in progress.
- Calculation: Count of opportunities with a status of "Open" or "In Progress."
- Example: If there are 15 open opportunities, Opportunities in Progress = 15.
-
Total Value of Opportunities in Progress
- Description: Total value of all open opportunities still in progress.
- Calculation: Sum of the monetary value of all open opportunities.
- Example: If there are 5 open opportunities worth $10,000, $20,000, $15,000, $30,000, and $25,000, the Total Value = $100,000.
-
Total Value of Won Opportunities
- Description: Total value of all successfully closed (won) opportunities.
- Calculation: Sum of the monetary value of all closed-won opportunities.
- Example: If 3 opportunities were won with values of $50,000, $30,000, and $20,000, the Total Value of Won Opps = $100,000.
Target Achieved
|
KPI Name
|
Description
|
Formula
|
Required Fields
|
|
Target Attainment
|
Percentage of target revenue achieved.
|
(Won Revenue ) / Target Revenue
|
Won Revenue, Target Revenue
|
|
Forecast Accuracy
|
Accuracy of revenue forecasts compared to actual revenue.
|
((Forecast Revenue - Corporate Revenue) / Forecast Revenue) * 100
|
Forecast Revenue, Actual Revenue
|
Important notes:
- This widget will be reflected by the "Target_Revenue" Date.
Description to be added in the "info" button:
-
Target Achievement
- Description: Measures how close the team is to reaching their sales target in terms of won revenue.
- Calculation: (Total Value of Won Opportunities / Sales Target) * 100
- Example: If the sales target is $200,000 and $150,000 has been won, Target Achievement is ($150,000 / $200,000) * 100 = 75%.
Sales efficiency
|
KPI Name
|
Description
|
Formula
|
Required Fields
|
|
Average Opportunity Value
|
Average value of opportunities.
|
Total Opportunity Value / Number of Opportunities
|
Opportunity Value, Number of Opportunities
|
|
Average Time to Close Opportunity (days)
|
Average time taken to close an opportunity.
|
Sum of time to close opportunities[won] / Number of closed opportunities[won[
|
Time to Close, Number of Closed Opportunities
|
Description to be added in the "info" button:
- Average Deal Value
- Description: The average monetary value of closed opportunities.
- Calculation: Total Value of Closed Opportunities / Number of Closed Opportunities.
- Example: If the total value of 4 closed deals is $100,000, the Average Deal Value is $100,000 / 4 = $25,000.
- Average Time to Close (Days)
- Description: Average number of days it takes to close an opportunity (won or lost).
- Calculation: Sum of days from opportunity creation to close / Number of closed opportunities.
- Example: If 3 opportunities closed in 20, 30, and 40 days, the Average Time to Close is (20 + 30 + 40) / 3 = 30 days.
Revenue distribution by product
Total Won Revenue by product will be shown in descending order (From the biggest revenue to the lowest)
|
KPI Name
|
Description
|
Formula
|
Required Fields
|
|
Revenue distribution by products
|
Total revenue per product
|
Sum of won corporate revenue by product
|
Opportunity Product
|
Description to be added in the "info" button:
-
Revenue Distribution by Products
- Description: Breakdown of total revenue generated by different products sold.
- Calculation: Sum of revenue generated from each product as a percentage of total revenue.
- Example: If Product A generated $60,000 and Product B generated $40,000, Product A is 60% and Product B is 40% of total revenue.
Conversion rate by stage
Conversion Rate by Stage (examples)
|
Stage
|
Number of Opportunities
|
Conversion Rate Formula with Values
|
Conversion Rate %
|
|
Stage 1
|
10
|
(10/10) * 100
|
100%
|
|
Stage 2
|
8
|
(8/10) * 100
|
80%
|
|
Stage 3
|
6
|
(6/10) * 100
|
60%
|
|
Stage 4
|
4
|
(4/10) * 100
|
40%
|
|
Stage 5
|
3
|
(3/10) * 100
|
30%
|
Key items to be considered for the widget:
- Percentage of opportunities that move from one stage to the next in the sales process, considering the total opps in a period of time.
- The order of the stages should reflect the one in the Administrator settings.
- The stages should only display the ones that belong to the selected Process in the filter.
Description to be added to the "info" button:
-
Conversion Rate by Stage
- Description: Percentage of opportunities that move from one stage to the next in the sales process.
- Calculation: (Number of Opportunities moving from one stage to the next / Total Opportunities) * 100
- Example: If 10 opportunities moved from stage 1 to stage 2 out of 20, Conversion Rate for Stage 1 is (10/20) * 100 = 50%.
Level of engagement
- This will track the total amount of activities per period and the previous period.
- This widget will follow the selected date range in the filter.
- ex. If the user chooses "This Month" -> The widget will show "This Month", etc.
- The X-axis should show the weeks.
- The Y-axis should show the total activities.
Description to be added to the "info" button:
-
Level of Engagement
- Description: Measures the total number of meaningful interactions (calls, emails, meetings) with clients for a given opportunity.
- Calculation: Sum of all interactions recorded for each opportunity during the sales cycle.
- Example: If a rep had 10 calls, 5 emails, and 3 meetings with a client, the Level of Engagement is 18 interactions
Activity distribution radar
- Use the "Polar Chart" widget in Sisense.
-
Configuration:
- Categories use: Interaction Type (BI_Timeline)
- Values: Average interactions (BI_Timeline)
-
Design:
- Polar type: Column
- Legend: Bottom
- Value label: enabled
- It should display the Average interactions.
Description to be added to the "info" button:
-
Activity Distribution Radar
- Description: Visual representation of how sales activities (calls, emails, meetings, etc.) are distributed across different types of engagement.
- Calculation: Total count of each activity type (calls, emails, meetings, etc.) represented in a radar chart.
- Example: If there were 30 calls, 20 emails, and 10 meetings, the radar chart shows the proportion of each activity type relative to the total number of activities.
FA Edition
Croesus V1 (Beta Release - Limited Availability)
For selected customers only. If you’re interested in enabling this integration for your team, please reach out to your assigned Account Manager. You can also get more information by emailing CAM@maximizer.com.
Discontinue User Voice
We have changed our way to collect feature requests. User Voice is no longer available. Users are encouraged to use the live chat to provide feedback directly to our support team. The link for Suggestions in Help Center has been removed.