
Filters
The Filters panel on the top of the dashboard provides data filtering options that affect the data displayed in the widgets. You can change these filters to focus on more specific data. Users can interact with filters and save their changes locally.
You can interact with filters for analyzing data, either through the Filters pane or by simply selecting values by left-clicking the widget visualization. Each time you interact with a filter, for example by selecting or entering a value, the filter is immediately applied to your dashboard. You will not affect anyone else by changing the filters., as all changes are stored locally.
We have different set of filters per dashboard, however all of them focuses on 5 main items:
- People
- Date
- Process
- Stage
- Products
You can interact with filters as follows:
- Make a different selection in the filter controls displayed in the Filter pane on the top of the dashboard, as shown below:
Expected filters per dashboard.
Sales Overview
1. People Picker
a. Filter that allows users to choose leaders and/or teams to filter information.
b. In this dashboard we include Owners & Teams, as image below
2. Owner/Team
a. Filter that allows users to choose leaders and/or teams to filter information.
b. In this dashboard we include Owners & Teams.
c. Conditionally, teams and/or owners are disabled, this will depend on the system configuration of the “Preferences” menu (Green box).
- If “Disabled users” checkbox is ticked, the users should see all owner and teams, including disabled and enabled users.
- Else, users will only see the list of all enabled users, and the list will hide all “disabled” users. However, data in the dashboards will still exist, that means that the only thing that users wont’ be able to do is to use the filter panel to search for that specific “disabled” user.
3. Date
4. Process
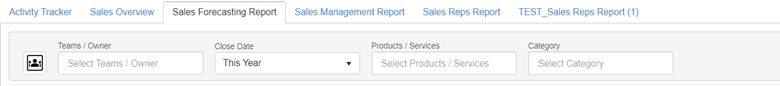
Sales Forecasting
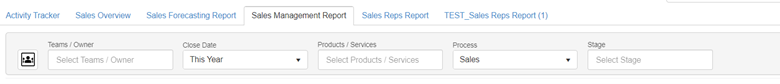
Sales Management
Sales Reps
Filters Data
- People Picker
- Filter that allows users to choose leaders and/or teams to filter information. We will use the existing people-picker that is used in the Opps viewer.
- Owner/Team
- Date
- Process
- Stage
- Products/Services
Drill down
This topic describes how you can drill down into your data in most widgets to get an in-depth view of a selected value.
To drill down into a chart:
- Right-click on the item in the widget into which you want to drill down.
- To manually select the drill hierarchy path, select Drill Into, and then in the In the Data Browser, select the field into which to drill down. If you have already drilled into this chart, then you will have shortcuts to previously selected fields, or select Choose Another Field to select a different field for the first time.
Click Through
Click through is a powerful feature that brings you from the dashboard down to the record level in Maximizer.
Not all charts types support click through. Supported chart types:
- Indicator (or KPI)
- Pie chart
- Bar chart
- Column chart
By default, all supported charts offer click through on the aggregated level out of the box.
Note: Click through can give return up to 1000 records in Maximizer. You will be notified if you've reached the maximum amount.
Time Zone Reporting
The time zone in Sales Intelligence is set per account, not per user as the rest of Maximizer WebAccess.
Some users might experience a discrepancy when they see a timestamp, e.g., a time of a record creation, in Sales Intelligence vs. the main app.
The reasoning behind this is that corporate reporting is done from a one time zone perspective (usually a headquarter time).
- To change time zone settings, you must be an Admin in Maximizer Web Access.
- Select a time zone in the drop-down list beside Report Time Zone.
- All your team members will see the time zone you chose reflected on the dashboards.
Download Widgets
Download widgets to share them with others, outside of the Sales Intelligence environment. For example, you can attach them to emails, include them in your own reports, and save them individually for use later.
To download the widget as an image or as a CSV file:
1. Click at the top right of the dashboard and select Download >
2. Pivot Charts and Tables can be downloaded as excel files and PDFs, follow the same instructions above.
To maintain security rules consistency across our platform, we need to follow the security rules at the system level. This means that starting on January 2024, Insights and Sales Intelligence will follow the export permissions configuration.
As a Maximizer administrator, you will be able to restrict each user’s privileges to export dashboards.
This security rule will apply to the following options:
- Export PDF reports.
- Export widgets as images.
We follow the same pattern as it already exists in the user's privilege rules, see example:
Each checkbox contains one of the following potential values:
The following table illustrates user access rights derived from user and group access settings.
If the user belongs to more than one group, the conflict illustrated below results in the user not being granted the access right.
According to the User Access Right, if the privileges are toggled OFF, meaning that user won't be allowed to "export", then we will disable the UI to block him from performing any export.
The steps to enable/disable the export privileges are:
- Log in to your Maximizer account as a system administrator.
- Access the “Administrator” page.
- Go to the left pane menu and click “Users” option.
- Click on “Access Rights” tab. Then you will see the Privileges options and the “allow export” checkbox (red rectangle).
- Enable or disable that option according to what you need.
Where can I export my dashboards?
The only place where we allow exports in Sales Intelligence and Insights is on the PDF button and on the 3 dots to download PDFs and/or images.
These buttons will show up according to the user's privilege configuration.
- If the user can export, then he/she will be able to see these buttons in the UI.
- If the user is NOT allowed to export, then these buttons will be hidden.
- This privilege configuration doesn’t affect other functions.
This is how the users will see whenever the buttons are hidden: